Correlation
White Wine
Quality vs All Features Violin Plot
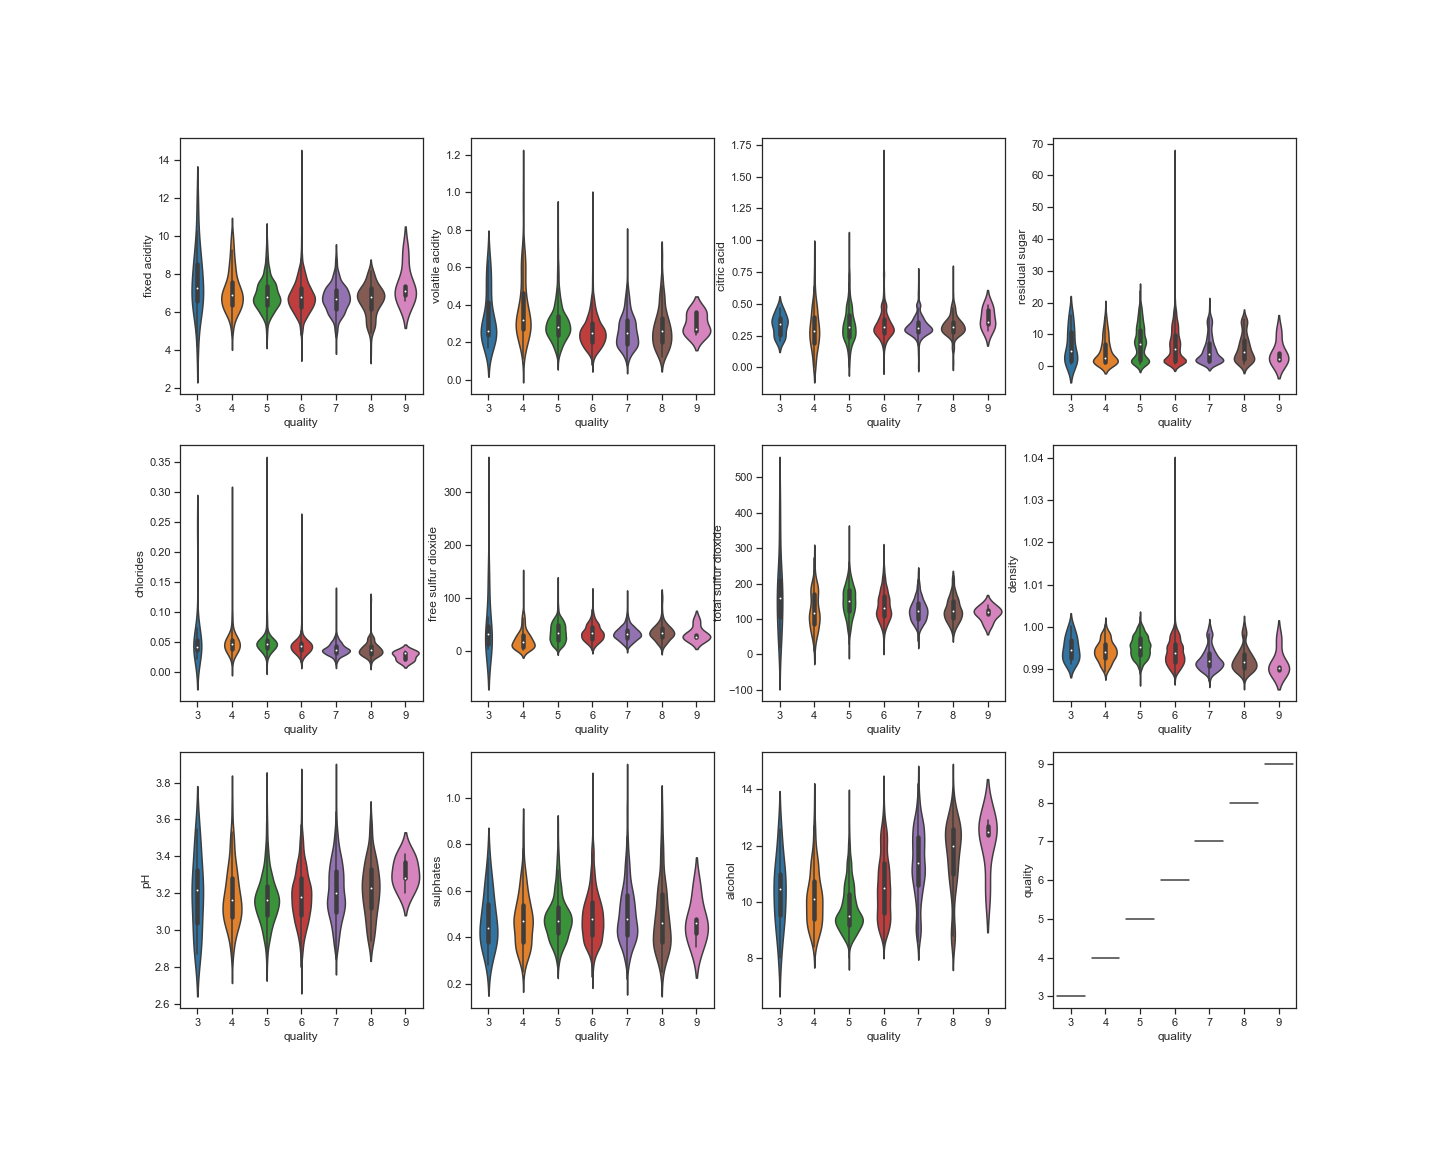
Violin plot helps quickly observe the distribution of wine data, with the mean, Q1, Q3, min, max. and the kernal density estimate (KDE),to compare between multiple factors.
Quality vs All Features Correlation Heatmap
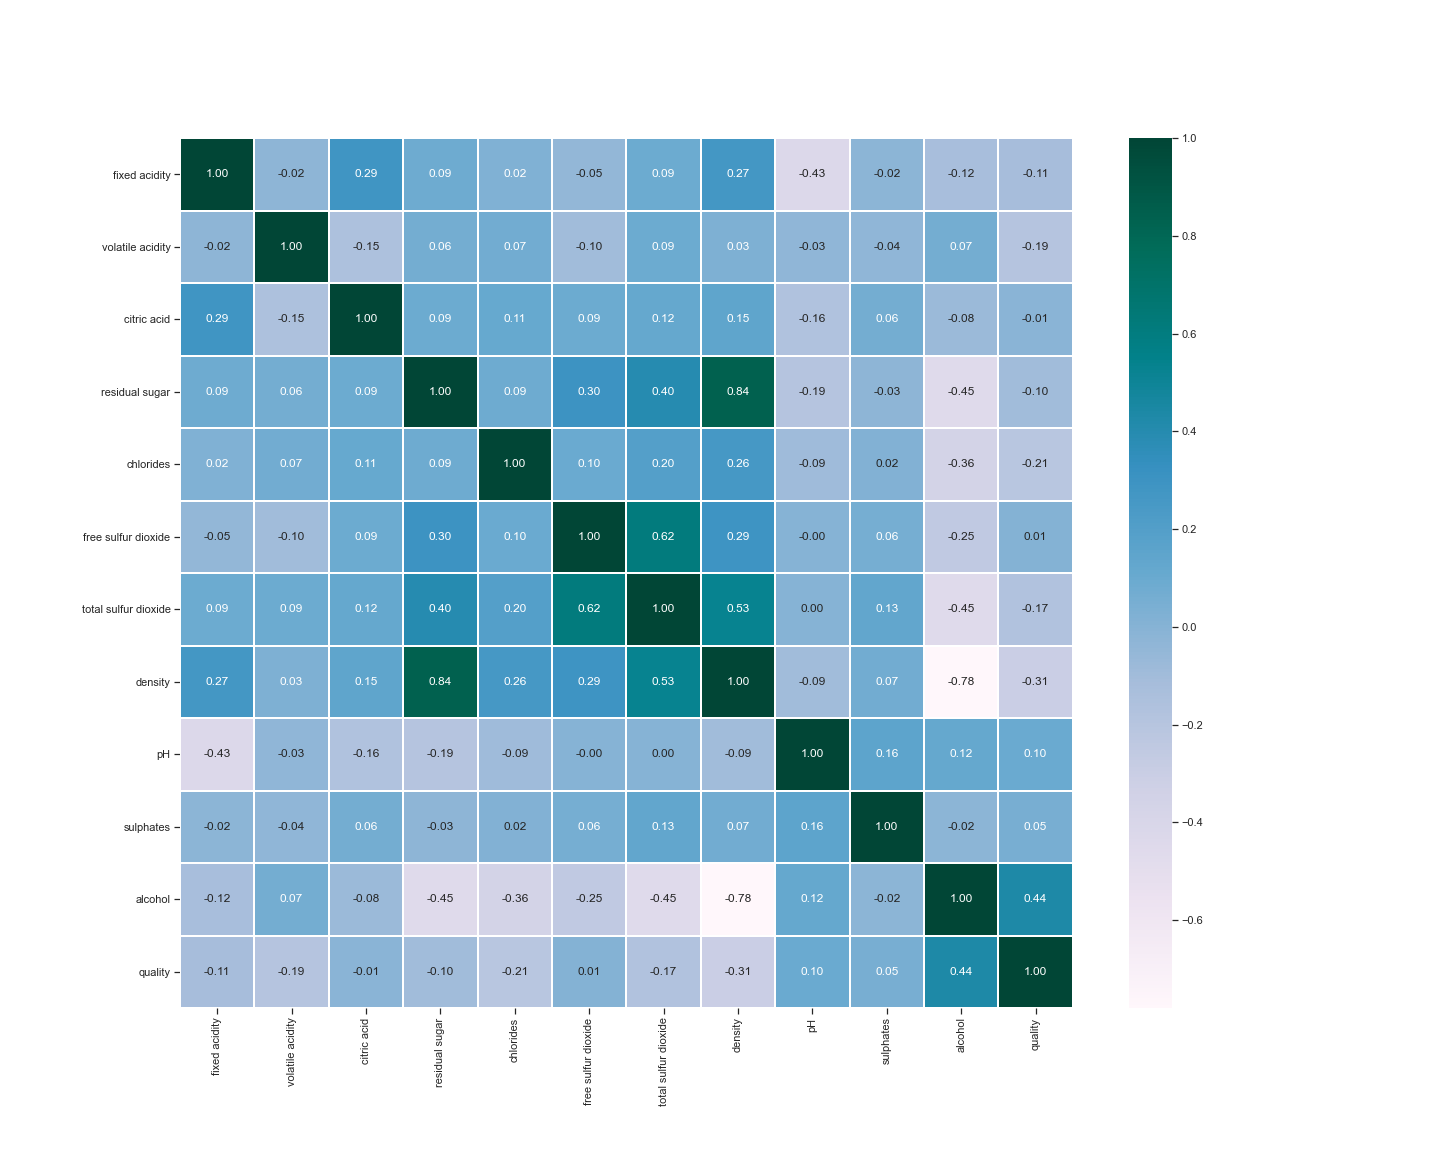
- Alcohol: 0.44
- pH: 0.10
- Sulphates: 0.05
- Free Sulfer Dioxide: 0.01
- Chlorides: -0.21
- Volatile Acidity: -0.19
- Total Sulfer Dioxide: -0.17
- Fixed Acidity: -0.11
- Residual Sugar: -0.10
- Citric Acid: -0.01
Positive Correlation :
Positive to No Correlation
Negative Correlation :
Negative to No Correlation
Summary
Quality has positive correlation with alcohol. As the median of alcohol increases, the quality tend to increase. Negative correlation with density. All other factors has rare to no correlation with quality.
Red Wine
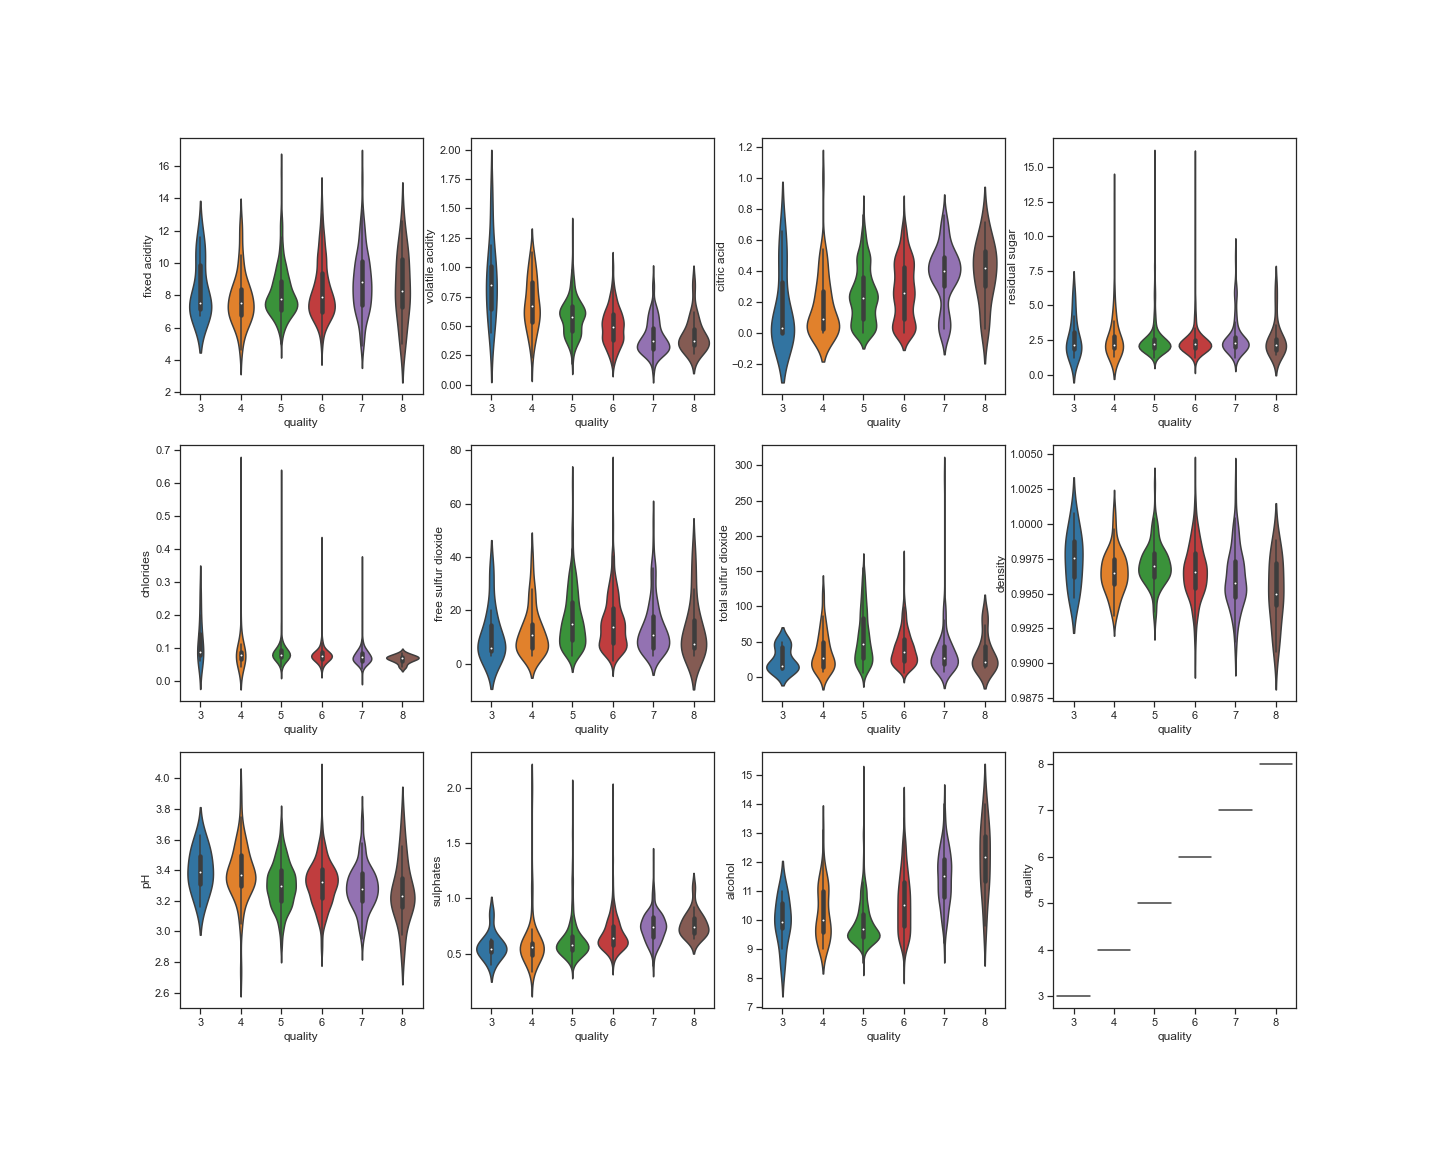
Quality VS All Features Violin Plot
Quality vs All Features Correlation Heatmap
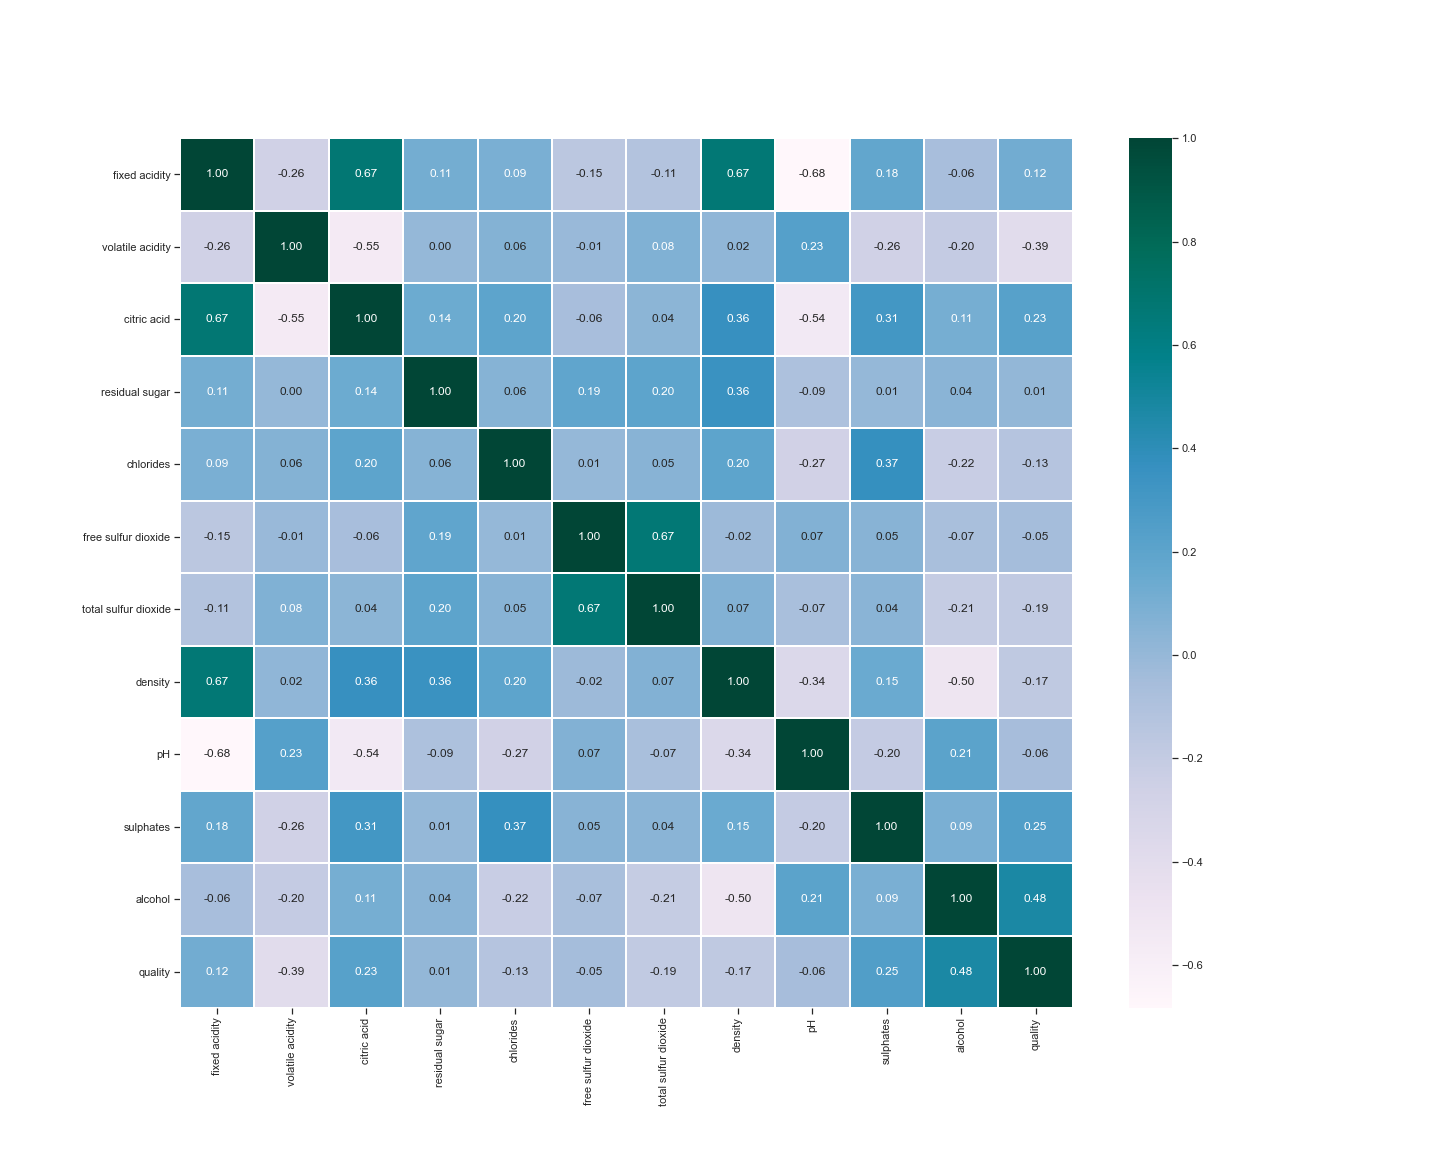
- Alcohol: 0.48
- Sulphates: 0.25
- Citric Acid: 0.23
- Fixed Acidity: 0.12
- Residual Sugar: 0.01
- Volatile Acidity: -0.39
- Total Sulfer Dioxide: -0.19
- Density: -0.17
- Chlorides: -0.13
- pH: -0.06
- Free Sulfer Dioxide: -0.05
Positive Correlation :
Positive to No Correlation
Negative Correlation :
Negative to No Correlation
Summary
Quality has positive correlation with citric acid, sulphates, and alcohol. Negative correlation with volatile acidity. All other factors has rare to no correlation with quality.